A 24-channel seismograph is our standard field setup for seismic tomography surveys in Chesapeake. We deploy geophones at 5-foot intervals along a spread that can reach 400 feet depending on project scale. A sledgehammer or accelerated weight drop generates the energy source, and we record both P-wave and S-wave arrivals. This approach works well across Chesapeake's varied geology, from the Coastal Plain sediments near the Elizabeth River to the more consolidated layers inland. The raw data undergoes refraction and reflection processing to build a velocity model of the subsurface. Our lab holds ISO 17025 accreditation for geophysical testing, and the team follows ASTM D4428 for crosshole and surface wave methods when applicable.
Seismic tomography in Chesapeake's coastal geology delivers continuous 2D velocity profiles that identify weathered zones and stratigraphic contacts often missed by discrete borings.
Approach and scope
Site-specific factors
A common mistake we see in Chesapeake is relying solely on standard soil borings to assess subsurface variability. In a coastal plain setting with lenses of sand, silt, and clay, a single boring per acre can miss a 10-foot-deep paleochannel filled with loose sand. That channel then goes undetected until foundation loads cause differential settlement. Seismic tomography fills that gap by providing a continuous profile across the site. It identifies velocity contrasts that often correspond to changes in material stiffness or groundwater saturation. Skipping this step can lead to redesign costs that far exceed the survey price.
Relevant standards
ASCE 7-22 (Seismic site classification), ASTM D4428/D4428M (Crosshole seismic testing), IBC 2021 (International Building Code, Chapter 16), NEHRP Recommended Provisions (Site Class determination)
Related technical services
2D Refraction Tomography
P-wave refraction survey with tomographic inversion to map bedrock depth and weathered zones. Ideal for transportation projects and landfill site assessment.
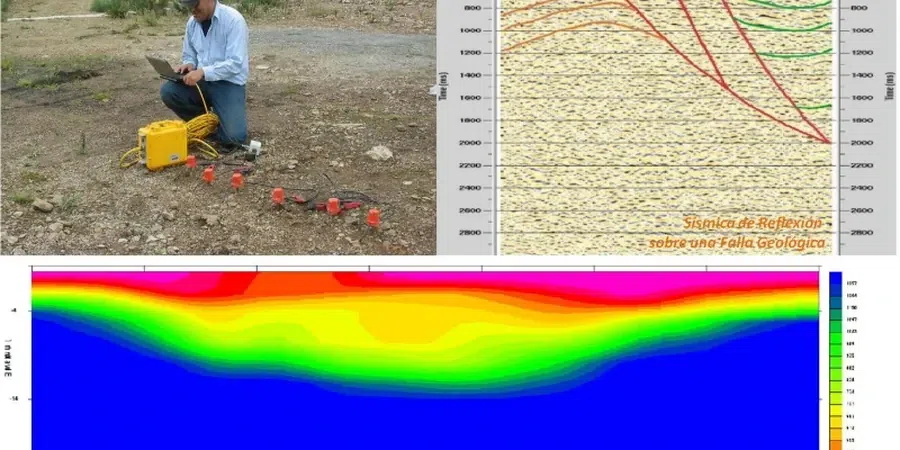
Reflection Survey (S-wave)
Shallow S-wave reflection profiling for stratigraphic detail and detection of faults or buried channels. Useful for bridge foundations and dam sites.
MASW (Multichannel Analysis of Surface Waves)
Surface wave analysis to generate Vs30 profiles for seismic site classification per ASCE 7. Non-invasive and fast for large area characterization.
Crosshole Seismic Tomography
Between-borehole P- and S-wave velocity measurements for high-resolution imaging. Applied to deep foundations and tunnel alignment studies in Chesapeake.
Typical parameters
FAQ
How deep can seismic refraction tomography reach in Chesapeake?
In Chesapeake's coastal plain geology, refraction surveys typically reach depths of 50 to 100 feet depending on spread length and energy source. With a 400-foot spread and accelerated weight drop, we can reliably image to about 80 feet. Deeper targets may require crosshole tomography or reflection methods.
What is the difference between refraction and reflection tomography?
Refraction tomography uses first-arrival travel times of P-waves to build a velocity model of the subsurface, best for mapping layer boundaries and weathered zones. Reflection tomography uses reflected S-waves or P-waves to resolve finer stratigraphic detail, such as thin clay layers or faults. We often combine both methods on a single survey line for comprehensive characterization.
How much does a seismic tomography survey cost in Chesapeake?
A typical 2D refraction tomography survey on a 400-foot line in Chesapeake ranges between US$2.930 and US$5.110 depending on line length, number of geophones, and data processing requirements. Crosshole surveys or combined refraction/reflection packages may cost more. Contact us for a site-specific quote.